The Livt extension brings project navigation, tool management, testing, and Livt Agent into VS Code. This guide follows the order you are likely to use them: prepare the environment, work on a project, then test and refine it. If you have not installed the extension yet, start with Install Livt.
Open the Command Palette with Ctrl + Shift + P to run the named commands below. The screenshots use a small HelloWorld project and the light theme; colours and panel positions may differ in your editor.
Account, installation, and licences
Your account connects VS Code to the software and licences available to you. Hover over the Livt account icon at the lower right of the status bar to see account information and management links. When signed in, the tooltip also shows available licence information. The signed-out view below explains what signing in enables and which features remain available locally.
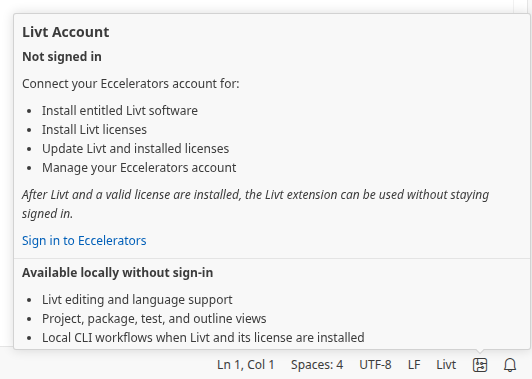
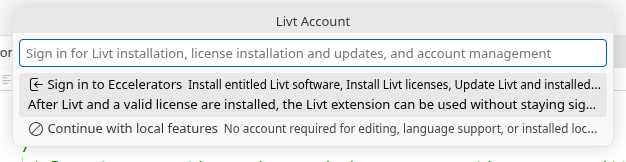
Click the account icon, or run Livt: Manage Eccelerators Account from the Command Palette. Choose Sign in to Eccelerators to authenticate in your browser, then return to VS Code. You can also run Livt: Sign in to Eccelerators directly.
Next, run Livt: Manage Livt Installation to manage the compiler and supporting tools. The menu offers installation or update actions according to your current setup, along with controls for Java, GHDL, and terminal access. Use the standard VS Code Extensions view to update the Livt extension itself.
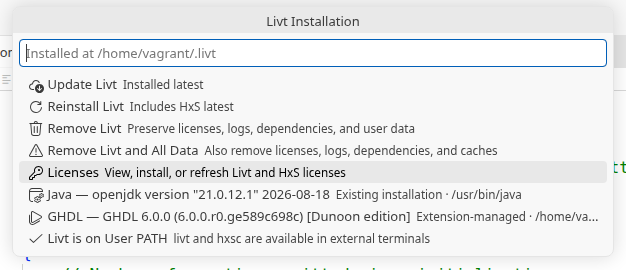
While signed in, select Licenses to inspect validity and installation status for your account. Install or Refresh Licenses installs the active licences available to you; Open Eccelerators Account opens account management in your browser. Once the local tools and a valid licence are installed, you do not need to remain signed in for local workflows: account sign-in manages access to downloads and licences, while the installed licence enables licensed local operations.
For the complete setup and update procedures, see Install Livt. With the environment ready, open a project to begin development; Hello, Livt! walks through creating one.
Find your way around
Select the Livt icon in the Activity Bar, the strip of icons normally shown on the far left. This opens the Livt side bar with the project tree, tests, outline, and Agent Context. The project tree provides the structure of your work, while the editor beside it displays the selected source file.
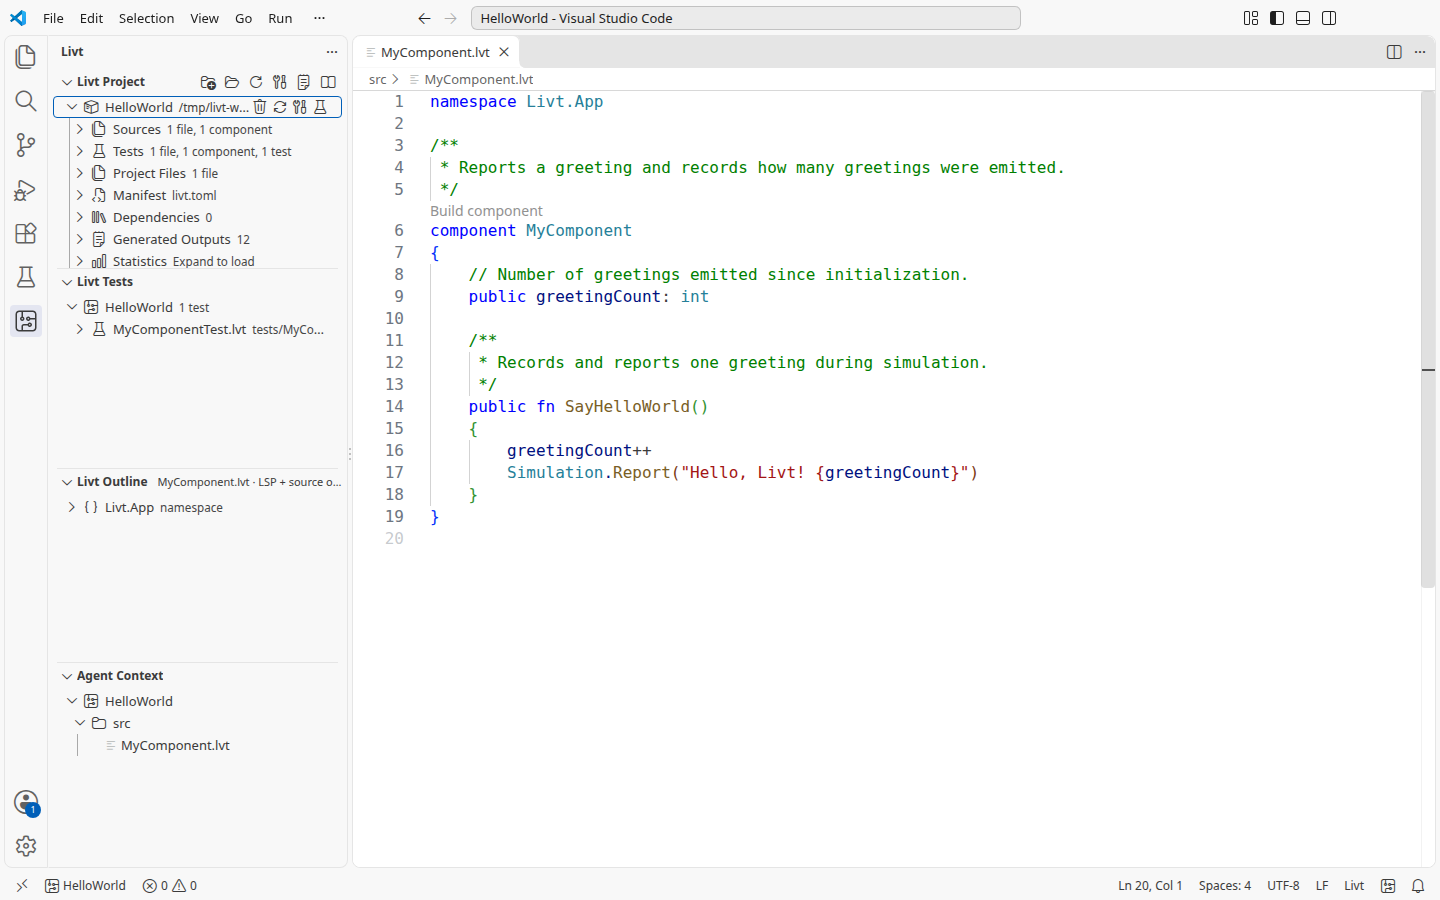
The Activity Bar also gives you access to the standard Explorer, Search, Extensions, and Testing views. Hover over an icon to see its name, and collapse individual Livt panels when you want more room for the current task. The bottom panel holds Problems, Output, and Test Results, so feedback remains close to the source.
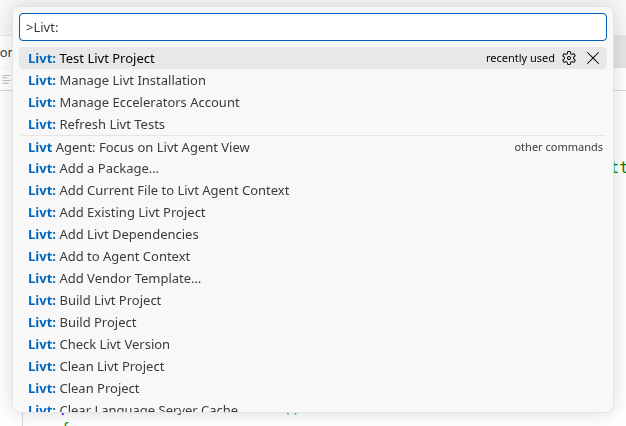
If you know the action but not where to find it, type Livt in the Command Palette. Add a word such as build or installation to narrow the list. Recently used commands may appear first.
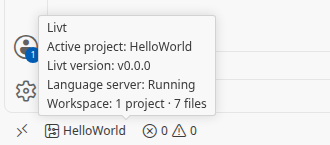
The Livt workspace status item at the lower left shows the Livt icon and either Livt or the active project name, such as HelloWorld. Hover over it to check the active project, compiler version, language-server status, and workspace summary.
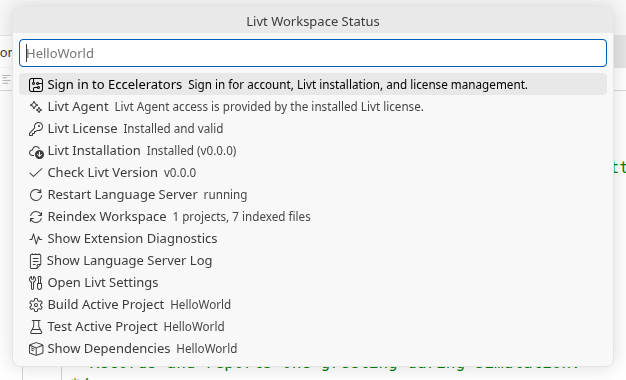
Click the same icon or label to open Livt Workspace Status. This menu combines environment information with useful actions for the active project. It also provides access to settings, extension diagnostics, and language-server controls when you need to inspect the editor's state.
Develop your project
The Livt Project view organises files by their role in the project. Expand a project to find its source, tests, configuration, dependencies, and generated output. The groups you see depend on the project and its configuration.
| Project node | Use it to |
|---|---|
| Sources | Open the Livt components that describe your design. |
| Tests | Find test components and test functions. |
| Project Files | Browse supporting project files beyond Livt source and tests. |
| Manifest | Inspect the project's livt.toml configuration. |
| Dependencies | Browse the packages used by the project. |
| Generated Outputs | Inspect generated files after a build. |
| Statistics | Inspect source and generated-output statistics. |
| Vendor | Find configured integrations with FPGA vendor tools. |
Use Livt Outline to navigate declarations in the current source file, or switch to the standard Explorer for the complete directory structure. As you edit, source diagnostics appear in the editor and the Problems view. Selecting a problem takes you to its source location, giving you feedback before you build or run a simulation.
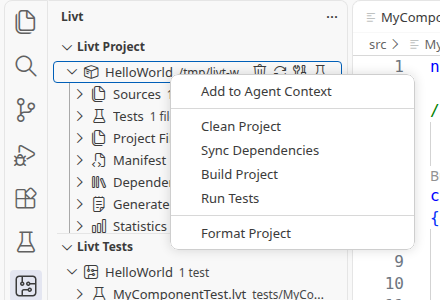
To build, save your changes, right-click the project in Livt Project, and select Build Project. The same menu offers dependency synchronisation, testing, and other project actions. In a workspace with several projects, using the intended project's menu makes the target explicit.
A build validates the design and generates HDL. Progress is shown while it runs; afterwards, expand Generated Outputs to inspect the result. These files are different from the logs in the Output panel. Treat generated files as build output rather than editing them in place, because a later build can replace them.
For configuration details, see Project configuration. The Hello, Livt! example explains how to relate the generated hardware to your source. Building prepares that hardware description; running tests checks its behaviour.
Run and inspect tests
Open Livt Tests in the Livt side bar or select the Testing icon in the Activity Bar to use VS Code's Test Explorer. Both views use the same discovered tests. Expand the tree to run an entire project, a test component, or an individual test function; use a focused run while developing and a wider run when checking the surrounding behaviour.
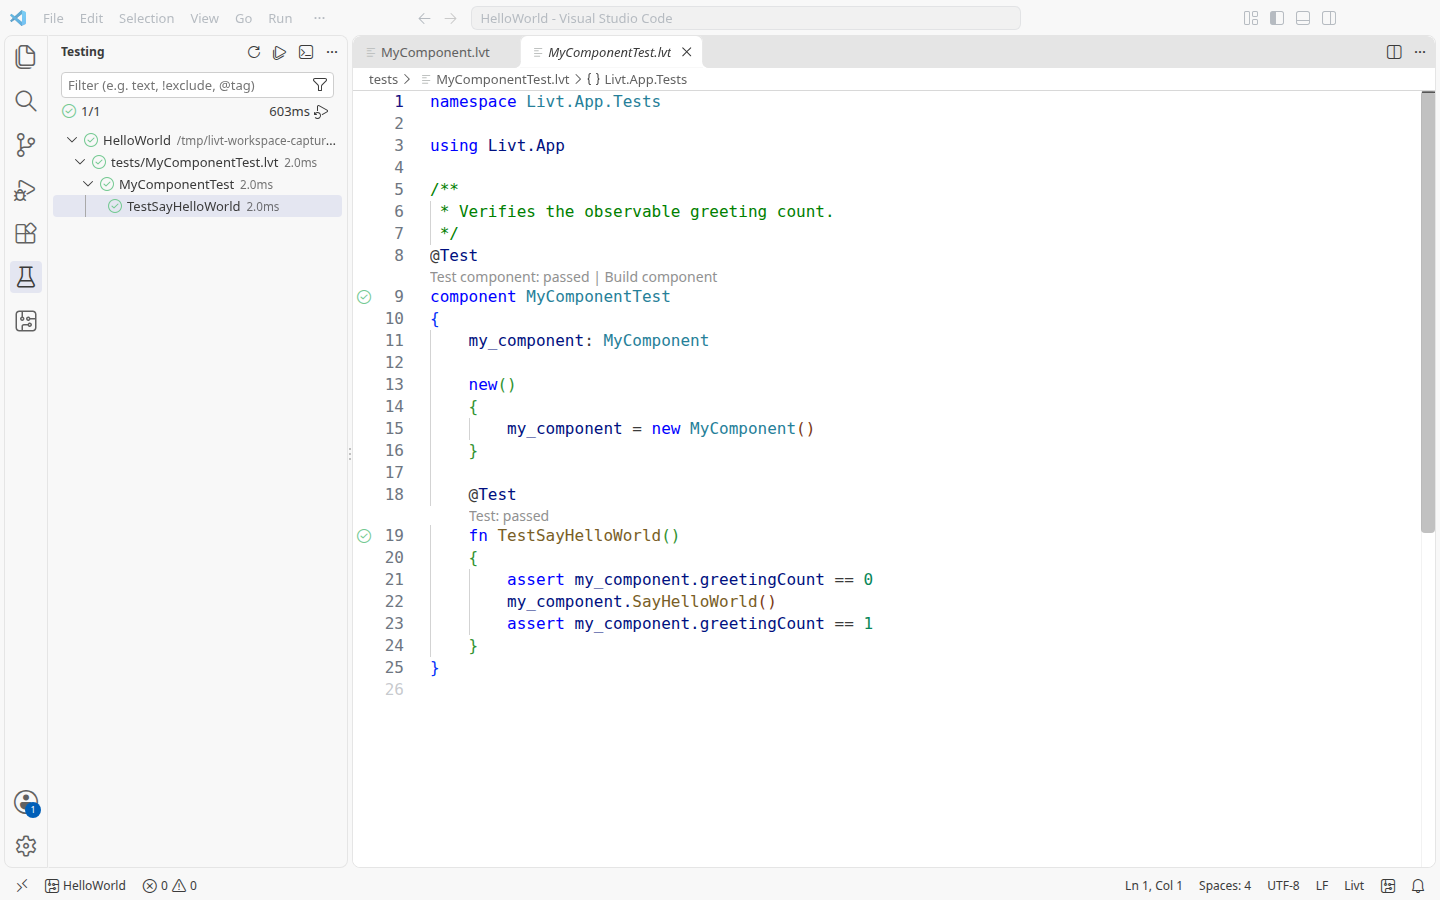
The result appears beside the test, and selecting it takes you to its source. When a test fails, inspect its output and assertion before changing the code, then rerun the affected test. Use Show Output in the Testing view to inspect the run. Source diagnostics and a successful build are useful checks, but neither replaces executing these tests. See Testing Livt code for test design and execution details.
Work with Livt Agent
Livt Agent can help explain code, plan changes, implement components, and work with build and test feedback. Start by choosing the files relevant to the task in Agent Context, the panel in the Livt side bar. Right-click a project, folder, or file and choose Add to Agent Context, or use Livt: Add Current File to Livt Agent Context for the file you are editing.
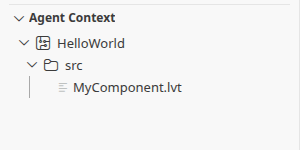
Context defines which project paths the agent may use; opening a file in the editor does not grant that access. Keep the scope appropriate to the task, and include tests or configuration deliberately when needed. Adding context is not the same as sending a request: review any hosted-content consent before allowing project content to be sent to a hosted service.
Open the Command Palette, search for Livt Agent, and select its focus command to open the chat view. Start a new chat using the new-chat button, describe what you want to achieve, and choose the available agent and approval mode. The screenshot shows an unsent question with Ask first selected, alongside the source and its authorised context.
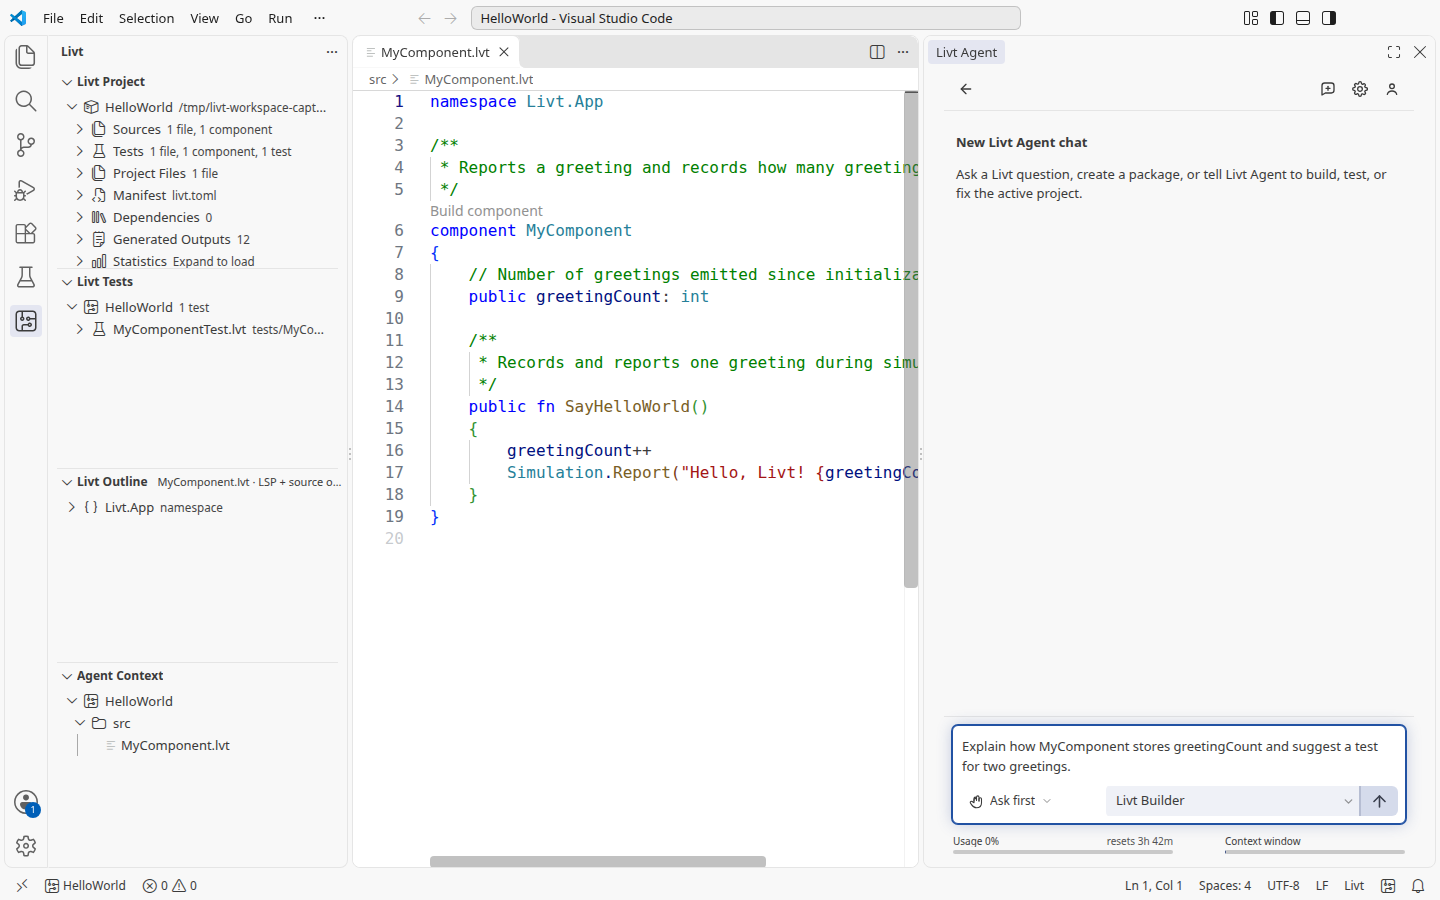
For a larger change, ask for a plan before implementation. Review proposed edits and requested actions, then use the same build and test views to check the result. Keep changes small enough to understand: an agent's explanation is useful, but the source and verification results remain the basis for review.